Blog | Scholarly Communication Analytics
We provide data-driven insights into scholarly communication and are based at the Göttingen State and University Library. Find out more about us and our publicly available Open Scholarly Data Warehouse.
On our blog, we share case studies using open metadata and tools.
Latest Posts

Decreasing affiliation metadata coverage in OpenAlex
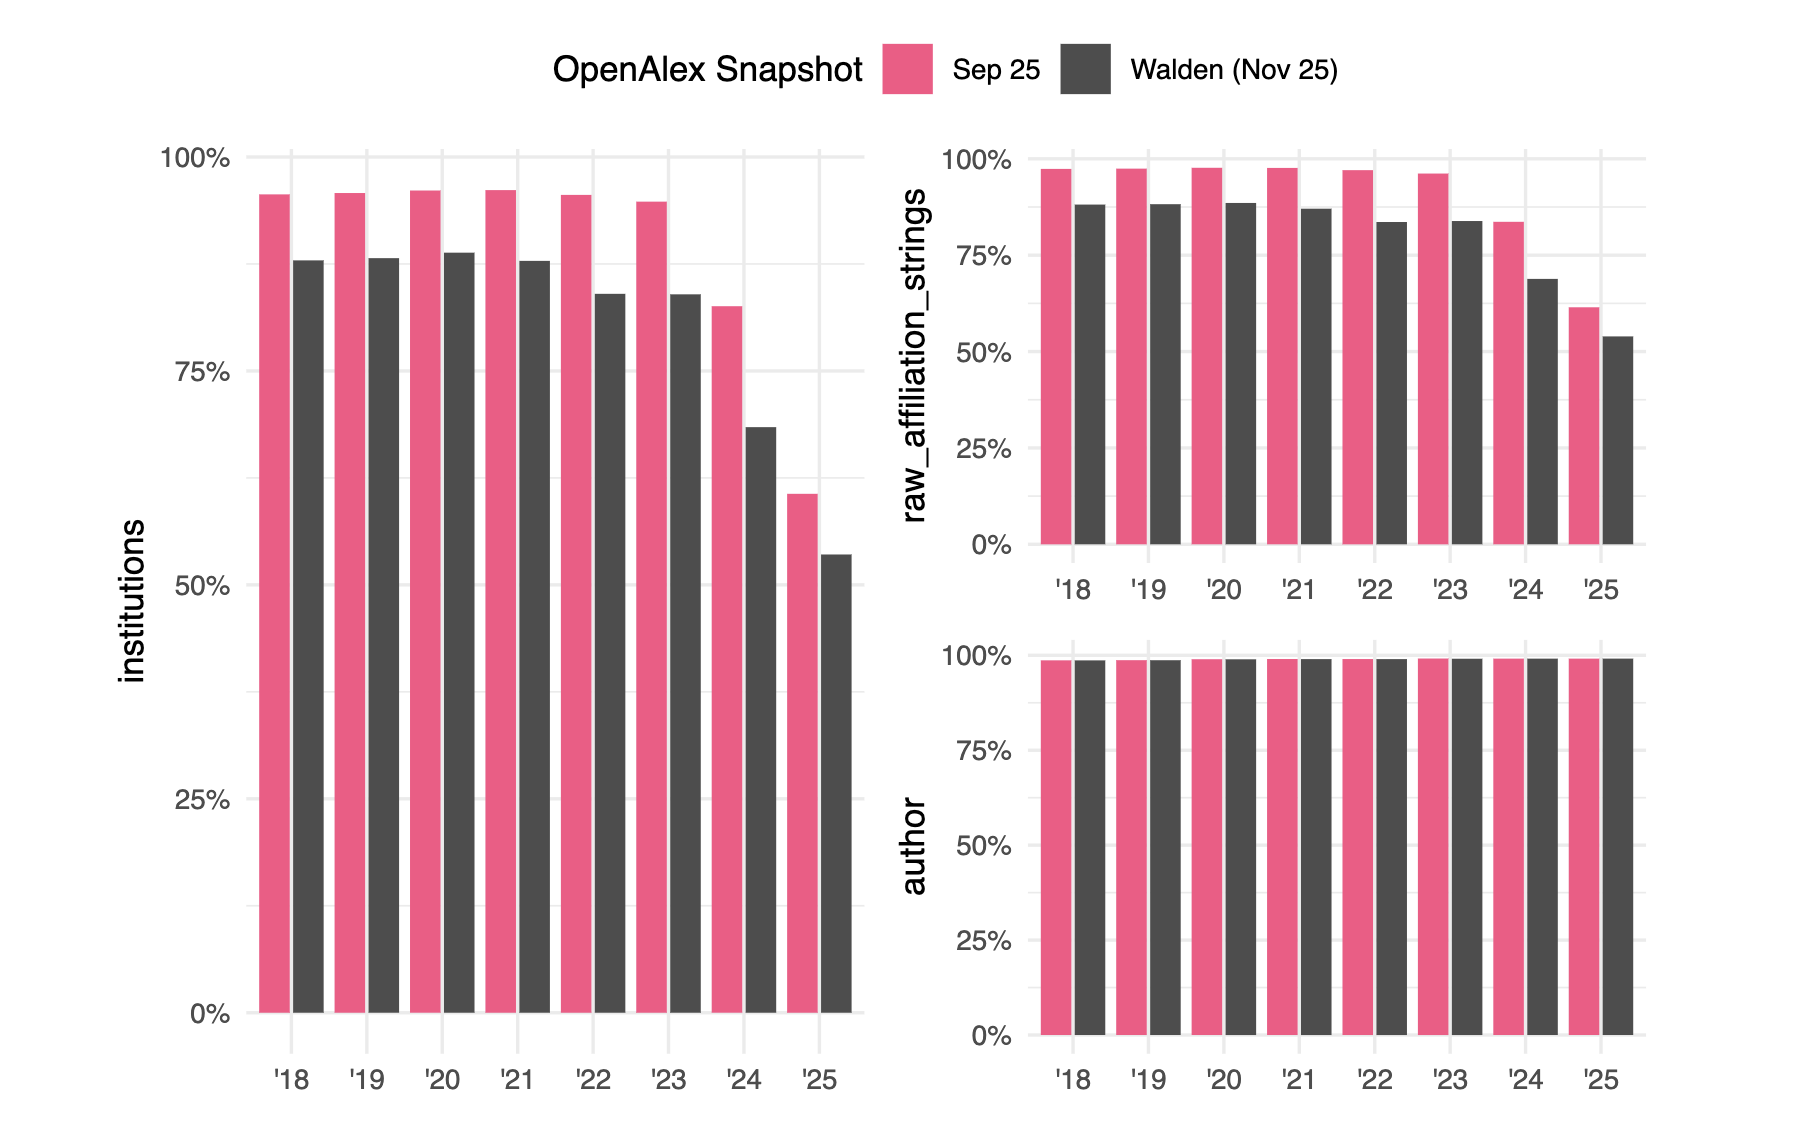
This blog post examines the decrease in affiliation metadata coverage in OpenAlex. An analysis of over 13 million articles published by major commercial publishers between 2018 and 2025 suggests that this is probably because publishers have not provided Crossref with sufficient affiliation metadata. However, technical issues also seem to have occurred during the transition to Walden, the new version of OpenAlex. Elsevier, the largest publisher, stands out in particular.

Is Semantic Scholar suitable for enriching references in OpenAlex?
This blog post explores the question whether metadata from Semantic Scholar can be used to enrich references in OpenAlex. To do this, I will compare the reference numbers in Semantic Scholar with those in OpenAlex. Analysing over 37 million journal articles between 2015 and 2023, I found strong evidence of potential benefits from integrating reference data from Semantic Scholar into OpenAlex.

Introducing Open Metadata about Transformative Agreements
This post presents a new dataset that combines open metadata from the cOAlition S Journal Checker Tool and OpenAlex to analyse transformative agreements. Data on these much-discussed agreements are scattered across different sources and are only partially available. To address this, we preserved and combined open metadata from the cOAlition S Journal Checker Tool and OpenAlex, resulting in a unified dataset for large-scale bibliometric studies.

Changes in evidence for green open access in Scopus
In March 2024, Scopus announced changes to its open access tagging policy to better align with the Unpaywall definitions. In this blog post, I examine the impact of the policy change by comparing three Scopus snapshots, comprising around 20 million records. Although the overall share of open access did not change, the analysis found a decrease in the number of copies in repositories, affecting about 2 million items, that cannot be explained by Unpaywall changes.

Identifying journal article types in OpenAlex
Identifying suitable types of journal articles for bibliometric analyses is important. In this blog post, I present a document type classifier that helps to identify research contributions like original research articles using Crossref and OpenAlex. The classifier and classified OpenAlex records are openly available.

Recent Changes in Document type classification in OpenAlex compared to Web of Science and Scopus
In June 2024, we published a preprint on the classification of document types in OpenAlex and compared it with the scholarly databases Web of Science, Scopus, PubMed and Semantic Scholar. In this follow-up study, we want to investigate further developments in OpenAlex and compare the results with the proprietary databases Scopus and Web of Science.

Analysing and reclassifying open access information in OpenAlex
We investigated OpenAlex and found over four million records with incompatible metadata about open access works. To illustrate this issue, we applied Unpaywall's methodology to OpenAlex data. The comparative analysis revealed a shift, with over one million journal articles published in 2023 that were previously labelled as "closed" in OpenAlex, being reclassified as "gold", "hybrid", "green", or "bronze".

How open are hybrid journals included in nationwide transformative agreements in Germany?
We present hoaddata, an experimental R package that combines open scholarly data from the German Open Access Monitor, Crossref and OpenAlex. Using this package, we illustrate the progress made in publishing open access content in hybrid journals included in nationwide transformative agreements in Germany across journal portfolios and countries.

Accessing and analysing the OpenAIRE Research Graph data dumps
The OpenAIRE Research Graph provides a wide range of metadata about grant-supported research publications. This blog post presents an experimental R package with helpers for splitting, de-compressing and parsing the underlying data dumps. I will demonstrate how to use them by examining the compliance of funded projects with the open access mandate in Horizon 2020.

Exploring the Open Access Evidence Base in Unpaywall with Python
Open Access evidence sources constantly change. In this blog post, I present a Python based approach for analysing the most recent snapshots from the open access discovery service Unpaywall. Results shows a growth in open access content, partly because of newly introduced evidence sources like Semantic Scholar.

Mining and analysing invoice data from Elsevier relative to hybrid open access
Publishers rarely make publication fee spending for hybrid journals transparent. Elsevier is a remarkable exception, as the publisher provides open and machine-readable data relative to its central invoicing with funding bodies and fee waivers at the article level. This blogpost illustrates how to mine Elsevier full-texts for these data with the data science tool R and presents new insights by analysing the resulting dataset: of 70,657 articles published open access in 1,753 hybrid journals from 2015 to date, around one third of the publication fees were paid through central agreements. Nevertheless, the majority of funding sources for hybrid open access remains unclear.

Interfacing the PID Graph with R
The PID Graph from DataCite interlinks persistent identifiers (PID) in research. In this blog post, I will present how to interface this graph using the DataCite GraphQL API with R. To illustrate it, I will visualise the research information network of a person.

Open Access Evidence in Unpaywall
We investigated more than 31 million scholarly journal articles published between 2008 and 2018 that are indexed in Unpaywall, a widely used open access discovery tool. Using Google BigQuery and R, we determined over 11.6 million journal articles with open access full-text links in Unpaywall, corresponding to an open access share of 37 %. Our data analysis revealed various open access location and evidence types, as well as large overlaps between them, raising important questions about how to responsibly re-use Unpaywall data in bibliometric research and open access monitoring.