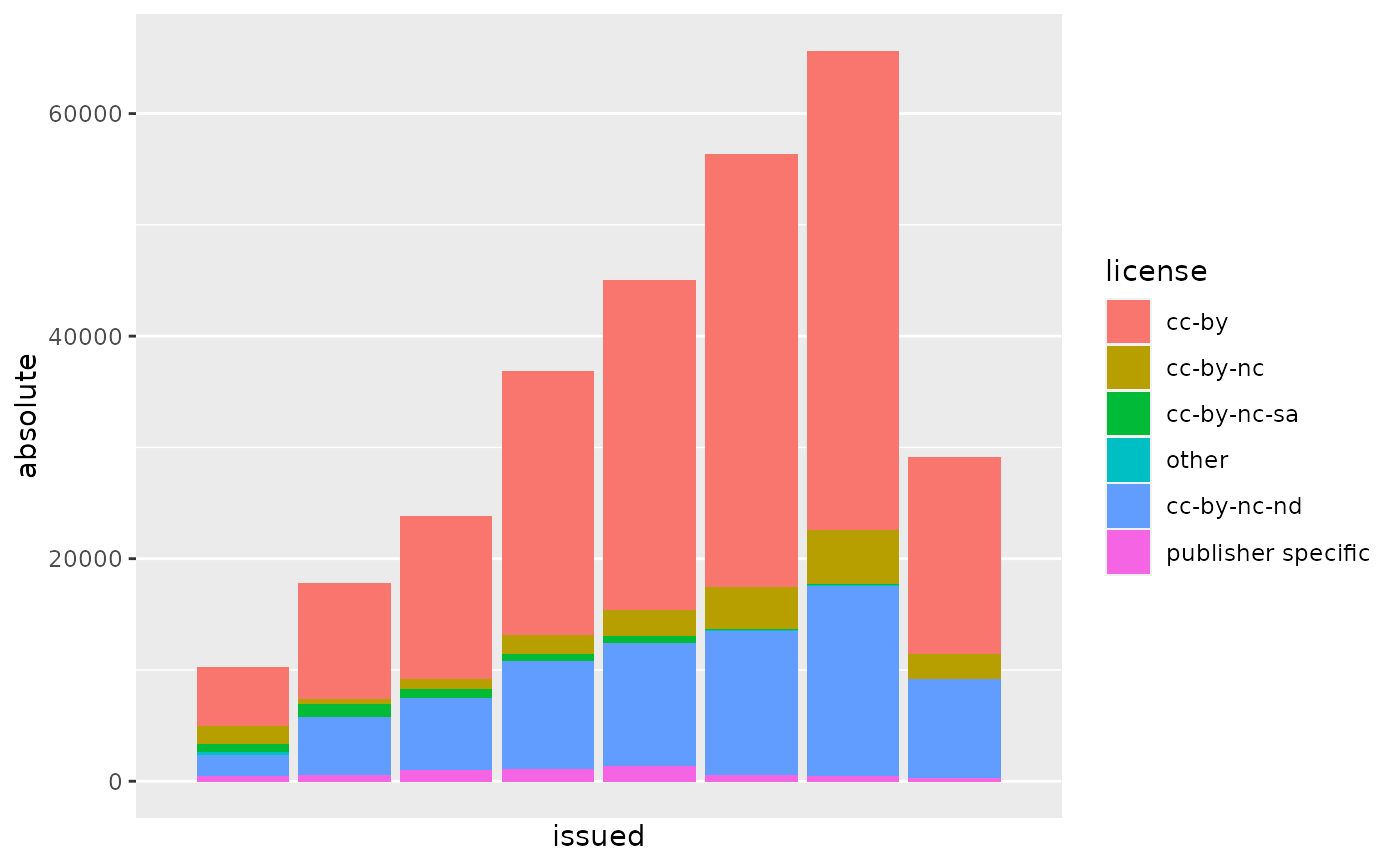
Open Access Articles by Year and License
oa_by_license()

oa_by_license_plot()
Related Functions and Methods
Functions
oa_by_license_plot: Plot by License and Year
See also
Other ETL functions:
oa_by_other()
Examples
oa_by_license()#> # A tibble: 48 x 3 #> # Groups: license [6] #> license issued absolute #> <fct> <int> <int> #> 1 cc-by 2013 5326 #> 2 cc-by 2014 10416 #> 3 cc-by 2015 14649 #> 4 cc-by 2016 23659 #> 5 cc-by 2017 29650 #> 6 cc-by 2018 38900 #> 7 cc-by 2019 43047 #> 8 cc-by 2020 17721 #> 9 cc-by-nc 2013 1584 #> 10 cc-by-nc 2014 469 #> # … with 38 more rowsoa_by_license_plot()